PROJECT 02 · DATA ANALYSIS · SQL · EXCEL · POWER BI
Credit Risk Analysis — Loan Default Prediction
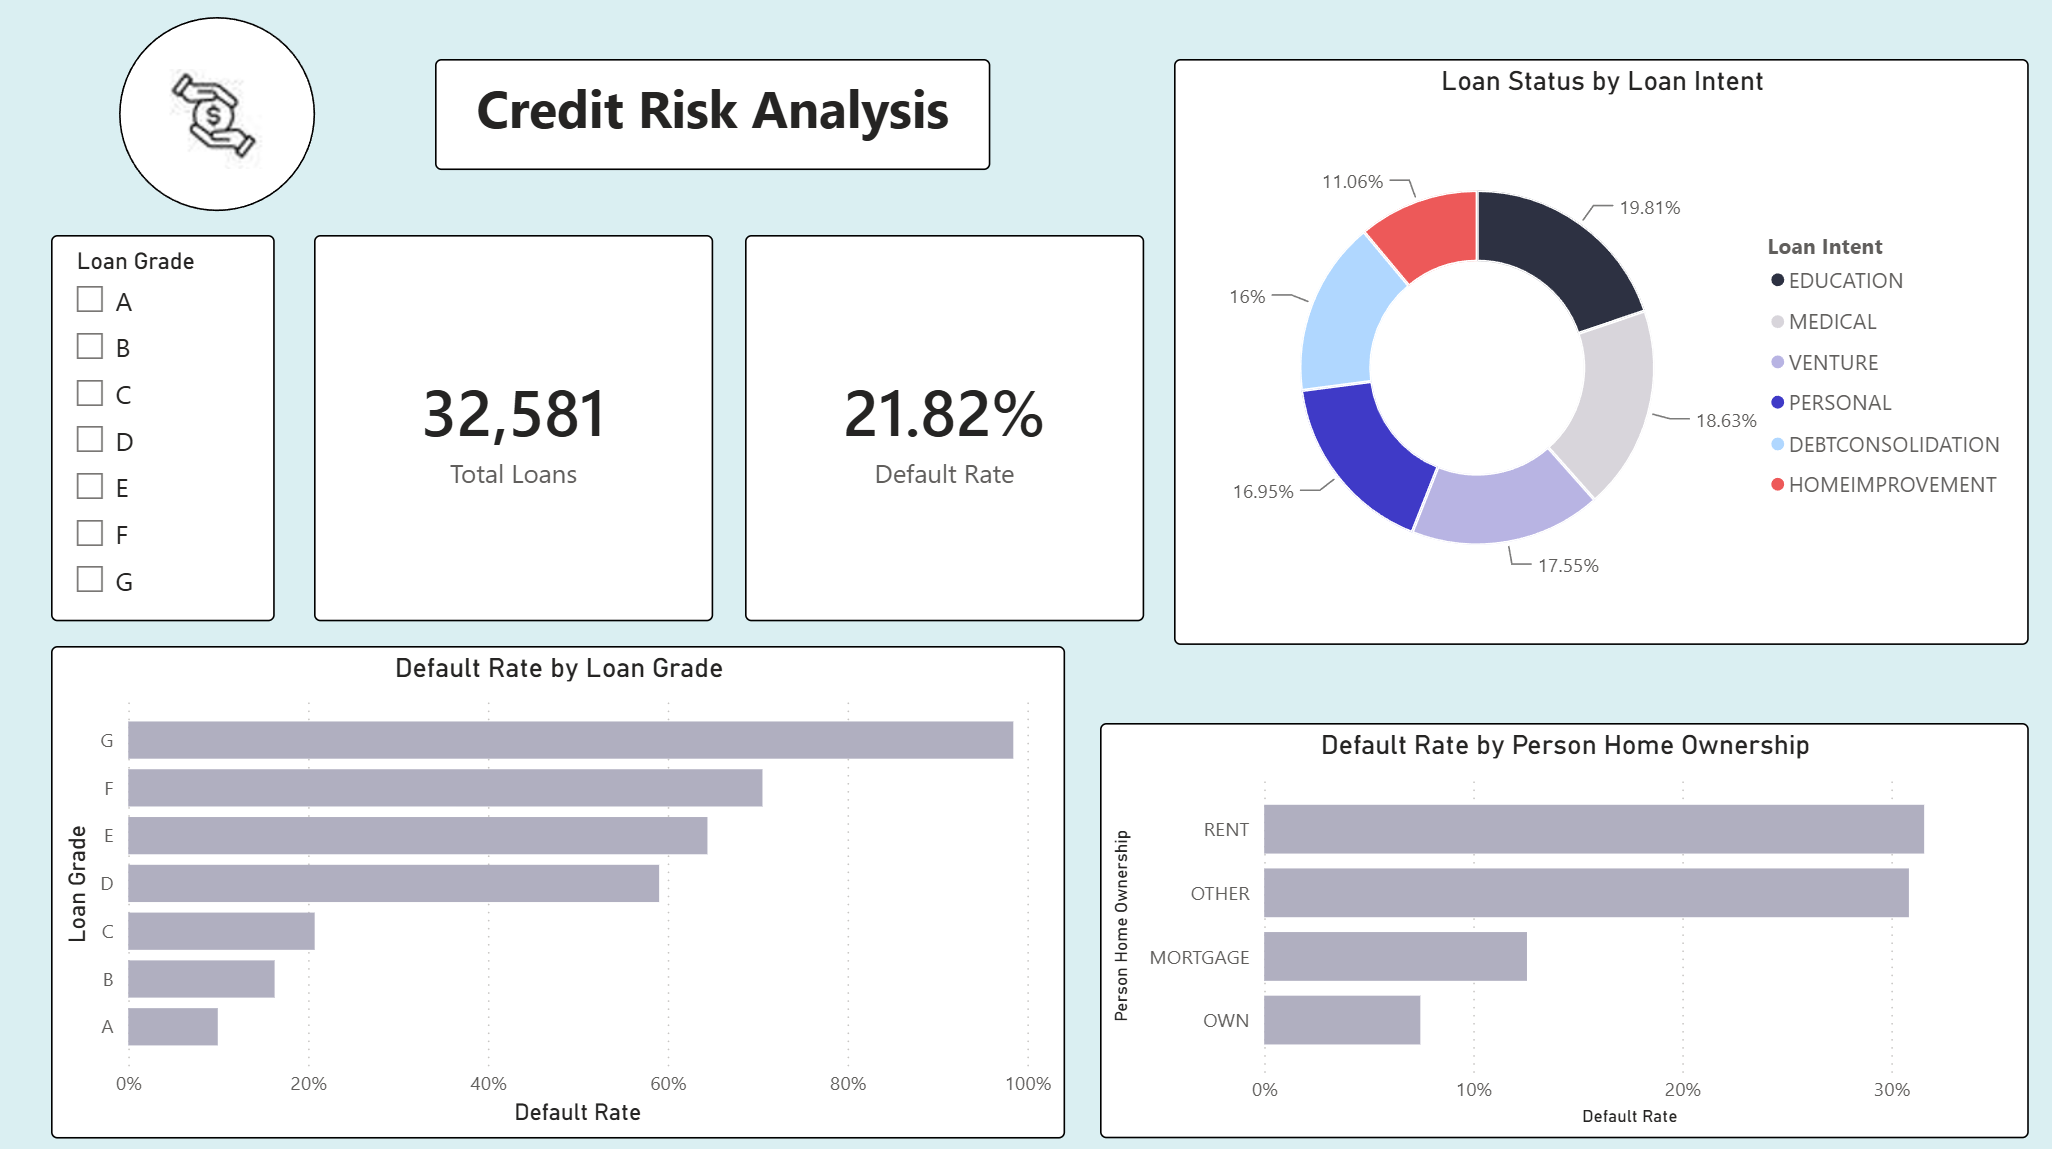
Analyzed 32,581 real-world loan records to identify the key factors that predict whether a borrower will default. Full analyst workflow: data cleaning and validation in Excel, 7 SQL queries for risk segmentation and borrower profiling, and an interactive Power BI dashboard with DAX measures, KPI cards, and traffic-light color scheme.
POWER BI DASHBOARD
Project Files
GitHub Repository
Source files · README
→
SQL Queries
7 analytical queries
Clean Dataset
Excel · 32,581 records
Power BI Dashboard
.pbix · Interactive
Key Findings
Finding 01
Loan Grade is the Strongest Default Predictor
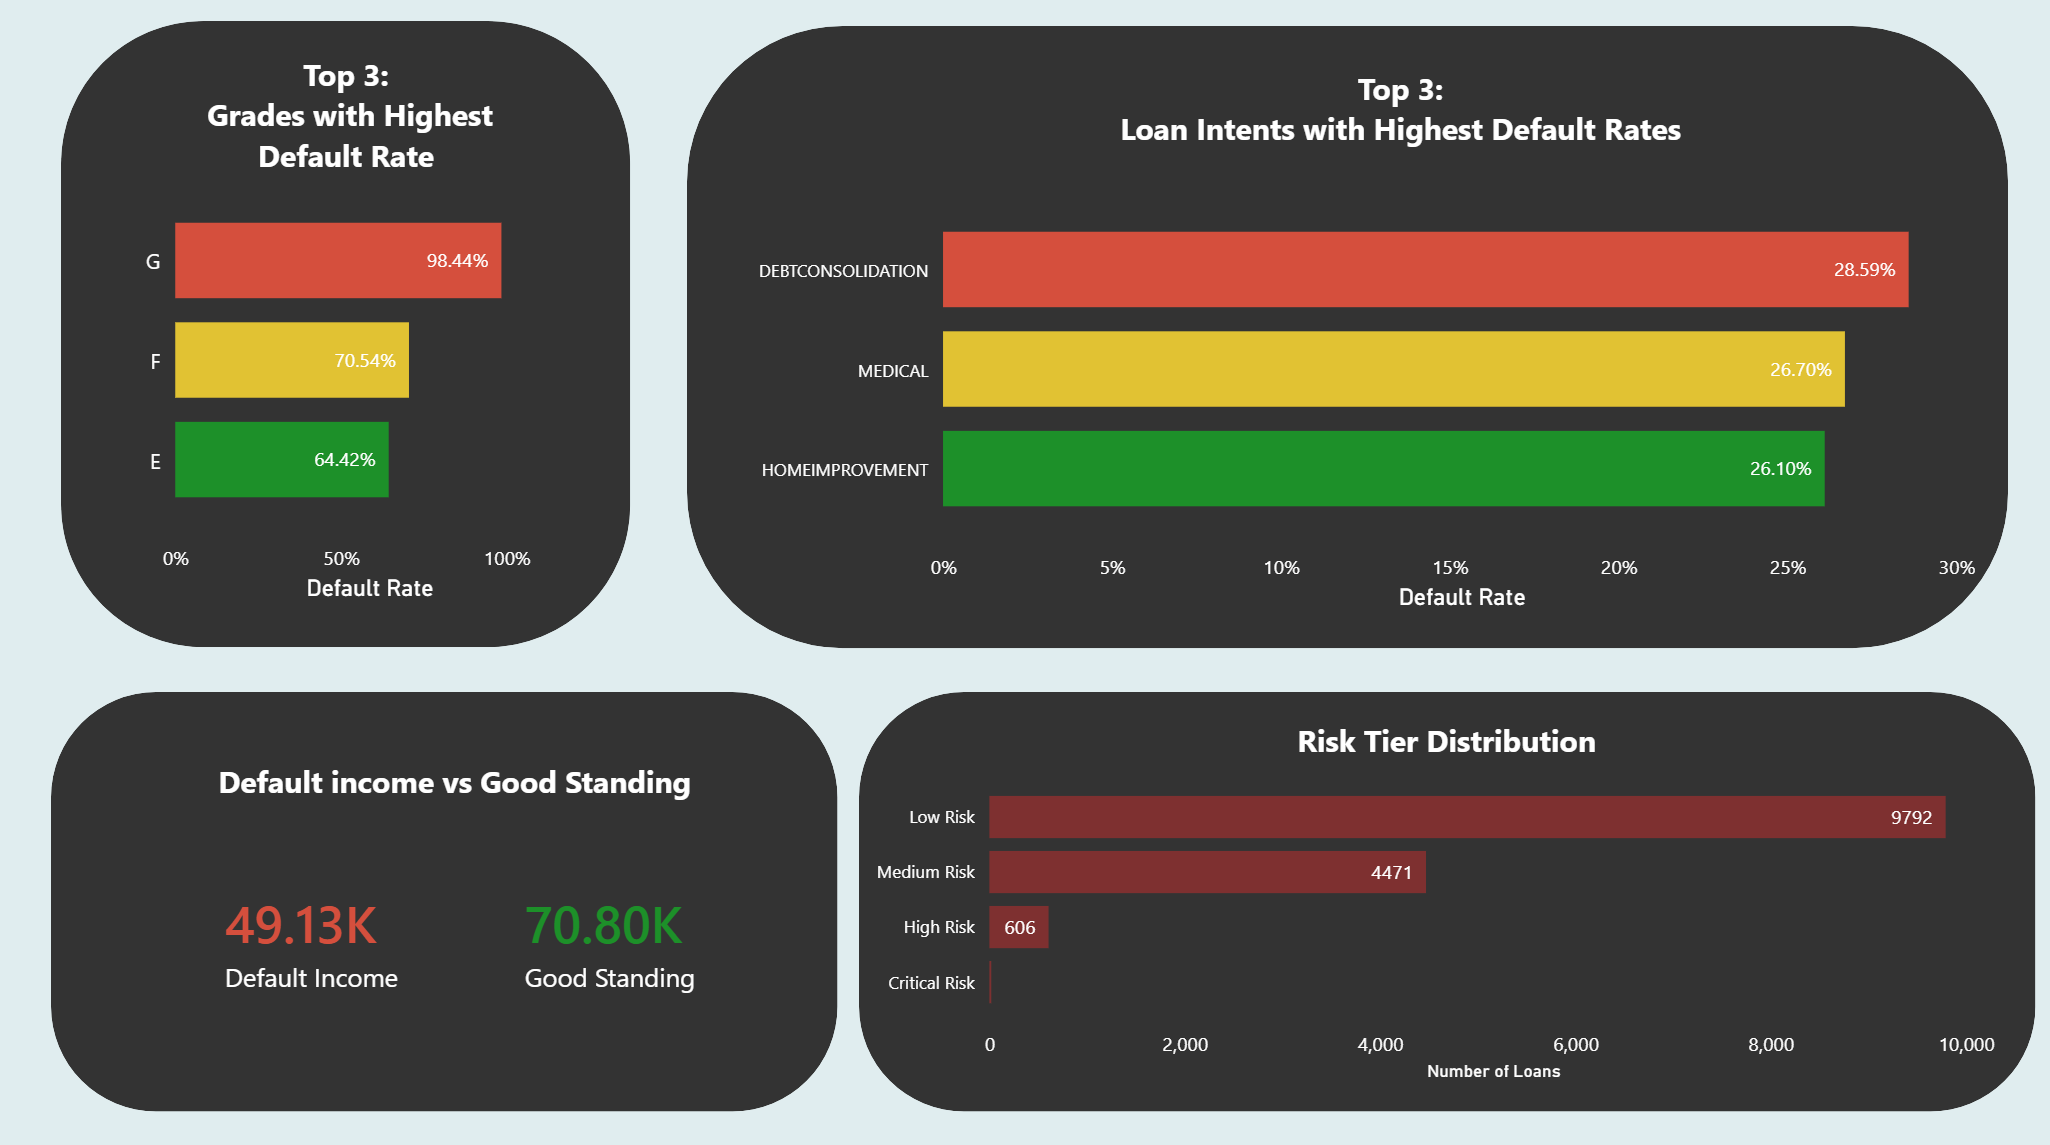
Grade G loans default at 98.44% — nearly guaranteed non-payment. Grades A and B show
default rates below 17%, confirming that credit grading accurately reflects risk. This
validates the grading system as the primary filter for loan approval decisions.
Finding 02
Home Ownership Signals Repayment Behavior
Renters default at 31% vs 7% for homeowners — a 4x risk difference. This suggests that
housing stability is a strong proxy for financial stability overall, and should be
weighted heavily in lending decisions alongside income.
Finding 03
Income Gap Between Defaulted and Good Standing Borrowers
Borrowers in default earn 31% less on average than those in good standing ($49K vs $70K
annually). Debt Consolidation loans show the highest default volume (1,490 loans at
28.59%), suggesting borrowers are already in financial distress at the time of application.
Analyst Workflow
Data Acquisition
Downloaded dataset from Kaggle — 32,581 loan records, 12 variables including borrower
demographics, loan characteristics, and repayment status.
Data Cleaning in Excel
Verified 32,581 unique records, identified and removed 1 duplicate using Conditional
Formatting, validated data types, confirmed no nulls in key columns, removed currency
symbols for clean CSV export.
SQL Analysis
Wrote 7 analytical queries covering: portfolio split by status, risk tier classification
by loan-to-income ratio, default rate by loan intent, borrower profile comparison,
default rate by home ownership, loan grade risk classification, and high-income
unexpected defaults.
Power BI Dashboard
Built two-page interactive dashboard: Portfolio Overview (KPI cards, default rate by
grade, by home ownership, loan intent donut) and Key Insights (top 3 grades/intents by
default rate, income comparison, risk tier distribution). Used DAX measures for dynamic
calculations.
Business Recommendations
Documented 4 actionable recommendations: restrict Grade E–G approvals, prioritize
homeowners in credit decisions, flag Debt Consolidation for enhanced review, and enforce
income verification as primary risk indicator.